The Facebook advertising market continues to expand rapidly, and effective ad operation is indispensable for business success. However, many marketers are drowning in a sea of data, missing truly important indicators.
In this article, we will explain in detail, from deciphering Facebook ad reports to data-driven campaign improvement, so that you can maximize the potential of Facebook ads and move steadily toward achieving your business goals.
This guide will lead your Facebook advertising strategy to the next level as a compass showing the path to success.
1. Introduction
Facebook advertising has become an indispensable marketing tool for many companies due to its sophisticated targeting and rich ad formats. However, to maximize its effectiveness, data-driven strategy formulation and continuous improvement are indispensable.
1) Basics of Facebook Ad Reports
What are Facebook Ad Reports?
Facebook ad reports aggregate and visualize performance data for advertising campaigns. Their main purpose is to support advertisers in measuring the effectiveness of their advertising activities and making decisions to maximize ROI (Return on Investment).

Types and Features of Reports
- Campaign Reports: Evaluate the effectiveness of the overall strategy.
- Ad Set Reports: Analyze the effects of targeting and placement.
- Ad Reports: Confirm the performance of individual creatives.
- Custom Reports: Enables analysis focused on specific metrics or periods.
2) Importance of Reports
Significance of Data-Driven Marketing
Data-driven marketing is a method of formulating and executing strategies based on objective data rather than human intuition or experience. This enables higher-precision decision-making, realizing improvement in marketing effectiveness and optimization of budgets.
Role of Reports in Improving Ad Performance
- Status Grasping: Accurately understand current ad performance.
- Identifying Problems: Discover low-effect elements or regions needing improvement.
- Formulating Improvement Measures: Formulate specific improvement measures based on data.
- Effect Measurement: Quantitatively evaluate the effect of implemented improvement measures.
3) Basic Way to Read Reports
Constituent Elements of Reports
- Period Selection: Setting the analysis target period.
- Metrics: Various numerical values for measuring performance.
- Graphs/Charts: Visualization of data.
- Segmentation: Analysis by attributes such as age, gender, and region.
- Customization Options: Extracting and displaying only necessary information.
Tips for Reading and Interpreting Data
- Grasping the Big Picture: First, check the overall trends of main KPIs.
- Comparative Analysis: Compare with past data or industry averages.
- Exploring Correlations: Analyze relations between different indicators.
- Checking Outliers: Pay attention to sudden changes or unexpected numerical values.
- Consideration of Context: Consider the influence of seasonality and external factors.
- Connecting to Actions: Translate insights obtained from data into specific improvement measures.
By grasping the above basics, you can effectively utilize Facebook ad reports and deploy strategic marketing measures based on data.
2. Explanation of Major Indicators (KPIs)
To accurately grasp the effectiveness of Facebook ads and lead them to improvement, it is indispensable to understand the major indicators (KPIs).
Here, we explain important KPIs in detail, divided into four categories.
1) Indicators Related to Reach and Awareness
a) Impressions
- Definition: Total number of times an ad was displayed.
- Importance: Basic indicator showing the degree of ad exposure.
- Precautions: Performance evaluation is difficult on its own because ads may be displayed to the same user multiple times.
b) Reach
- Definition: Number of individual users who saw the ad at least once.
- Importance: Shows how many people the ad actually reached.
- Utilization: Used when evaluating reachability to target segments.
c) Frequency
- Definition: Average number of impressions per reached user (Impressions ÷ Reach).
- Importance: Shows ad exposure frequency and serves as an indicator for awareness improvement.
- Optimization: Set appropriate frequency according to purpose (high for awareness improvement, low for fatigue prevention).

2) Indicators Related to Engagement
a) Click-Through Rate (CTR)
- Definition: Ratio of clicks relative to impressions (Clicks ÷ Impressions).
- Importance: Shows interest or attractiveness of the ad.
- Improvement: Improving creatives, optimizing targeting.
b) Engagement Rate
- Definition: Total sum of reactions, comments, and shares relative to Reach.
- Importance: Shows the degree of interaction with the audience.
- Utilization: Used for evaluating quality or relevance of content.

3) Indicators Related to Conversion
a) Conversion Rate
- Definition: Ratio of conversions (goal achievements) relative to clicks.
- Importance: Important indicator showing final ad effectiveness.
- Improvement: Landing page optimization, adjusting offers.
b) Cost Per Action (CPA)
- Definition: Cost per single conversion (Total ad cost ÷ Number of conversions).
- Importance: Shows efficiency of ad investment.
- Optimization: Improving targeting, bidding strategies, and creatives.
4) Indicators Related to Cost
a) Cost Per Click (CPC)
- Definition: Cost per single click (Total ad cost ÷ Number of clicks).
- Importance: Shows efficiency of traffic acquisition.
- Utilization: Used for competitor analysis and budget planning.
b) Cost Per 1000 Impressions (CPM)
- Definition: Cost per 1000 impressions.
- Importance: Shows efficiency of ad display.
- Application: Often used in brand awareness improvement campaigns.
c) Return on Investment (ROI), Return on Advertising Spend (ROAS)
- ROI Definition: (Profit - Investment amount) ÷ Investment amount × 100
- ROAS Definition: Total revenue ÷ Ad cost
- Importance: Shows overall profitability of advertising campaigns.
- Utilization: Judging criteria for continuing, expanding, or stopping campaigns.
By combining and analyzing these KPIs appropriately, you can accurately grasp the strengths and improvement points of Facebook advertising campaigns and perform effective optimization.
3. Analysis Methods at the Campaign Level
Analysis at the campaign level is very important for evaluating the overall strategy and effectiveness of Facebook advertising. Here, we explain comprehensive analysis methods from setting campaign goals to performance evaluation and cross-campaign analysis.

1) Setting and Evaluating Campaign Goals
Selecting Major KPIs According to Goals
- Improving Awareness: Reach, Impressions, Frequency
- Engagement: Click-Through Rate (CTR), Engagement Rate
- Traffic Acquisition: Number of Clicks, CPC
- Conversions: Conversion Rate, CPA
- Increasing Sales: ROI, ROAS
Measurement Methods for Goal Achievement Degree
- Setting specific numerical goals (e.g., Reach of 100k people, CTR of 2%, etc.)
- Setting a baseline (past performance or industry average).
- Regular progress checking (daily/weekly/monthly).
- Calculating goal achievement rate (Achieved value ÷ Goal value × 100)
- Trend analysis (whether things are improving toward the goal).
2) Performance Evaluation of the Entire Campaign
Analyzing Budget Pacing and Efficiency
- Calculating budget consumption rate (Spent budget ÷ Total budget × 100)
- Checking pace of daily budget consumption.
- Correlation analysis between budget consumption rate and KPI achievement rate.
- Evaluating efficiency indicators (CPC, CPM, CPA).
- Judging necessity for budget adjustment.
Checking Performance Transitions over Time
- Daily/weekly/monthly trend analysis.
- Checking influence of seasonality or specific events.
- Identifying causes for sudden changes in performance.
- Evaluating long-term improvement trends.
- Predictive analysis (future performance forecasting).
3) Cross-Campaign Analysis
How to Compare Multiple Campaigns
- Transverse comparison with common KPIs (CTR, CPC, Conversion Rate, etc.)
- Comparing goal achievement degrees.
- Comparing budget efficiency (ROAS, ROI, etc.)
- Overlap analysis of target audience.
- Comparing effects of creative elements.
Identifying Success Factors and Improvement Points
- Extracting features of high-performance campaigns.
- Targeting settings
- Creative elements
- Distribution settings (platform, time slots, etc.)
Problem Analysis for Low-Performance Campaigns
- Identifying weaknesses by KPI.
- Comparison with competitor analysis.
- Extracting and sharing best practices.
- Transverse analysis of A/B test results.
- Formulating improvement action plans.
4. Analysis at the Ad Set Level
Analysis at the ad set level is extremely important for performing detailed optimization of Facebook advertising campaigns. Here, we explain how to maximize ad set effects from three main aspects: targeting, placement, and A/B testing.

1) Effect Analysis of Targeting
Performance by Demographic
Analysis by Age Group
- Compare CTR, conversion rate, and CPA for each age group.
- Identify the most effective age group and adjust budget allocation.
Difference in Effect by Gender
- Compare engagement rates and ROAS by gender.
- Optimize creatives according to gender.
Performance by Region
- Analyze geographical factors such as Urban vs. Suburbs, by nationality, etc.
- Adjust messaging matched to regional characteristics.
Effect of Interest Targeting
- Effect measurement by interest category.
- Compare CTR and conversion rate of each category.
- Identify and expand high-performance categories.
Effect Analysis of Lookalike Audiences
- Comparison with source audiences.
- Performance comparison between audiences with different similarities.
Effect of Custom Audiences
- Compare effects of various custom audiences such as website visitors, app users, and customer lists.
- Analyze efficiency of Retargeting vs. New Customer Acquisition.
2) Optimization of Placement
Analysis by Platform (Facebook, Instagram, Audience Network, etc.)
- Compare reach and engagement rate for each platform.
- Analyze cost efficiency (CPC, CPM) by platform.
- Evaluate influence by difference in conversion paths.
- Optimize creatives matching platform characteristics.
Performance Comparison by Device (Mobile, Desktop)
- Analyze CTR and conversion rates by device.
- Grasp differences in user behavior between mobile and desktop.
- Optimize landing pages according to device characteristics.
- Tracking and analyzing cross-device conversions.
3) Implementation and Analysis of A/B Testing
Basics of Test Design
- Clarification of test objective (e.g., creative, headline, CTA).
- Setting sample size to obtain significant results.
- Determining test period (appropriate duration, neither too short nor too long).
- Control of variables (change only one element at a time).
- Selecting appropriate evaluation indicators (KPIs according to purpose).
Interpreting Results and Devolving to the Next Action
- Confirm statistical significance.
- Calculating and interpreting p-values.
- Confidence interval consideration.
Evaluating Practical Effect Size
- Calculating relative improvement rates.
- Cost-benefit analysis.
Analysis of Differences in Effects by Segment
- Differences by demographic, device, time slots, etc.
Deployment Plan for Winner Variation
- Strategy for scaling up.
- Application to other ad sets.
Formulating New Hypotheses
- Planning next A/B tests based on insights from test results.
Establishing Continuous Improvement Cycles
Incorporation into PDCA Cycle
- Cultivating a test culture.
By performing detailed analysis and optimization at the ad set level, you can significantly improve the effectiveness of Facebook ads. Considering each element of targeting, placement, and A/B testing comprehensively and making data-driven decisions is the key to success.
5. Steps for Campaign Improvement Based on Data
Success in Facebook advertising depends on continuous improvement based on data. Here, we provide specific steps for campaign improvement utilizing the PDCA cycle and tips for continuous optimization.
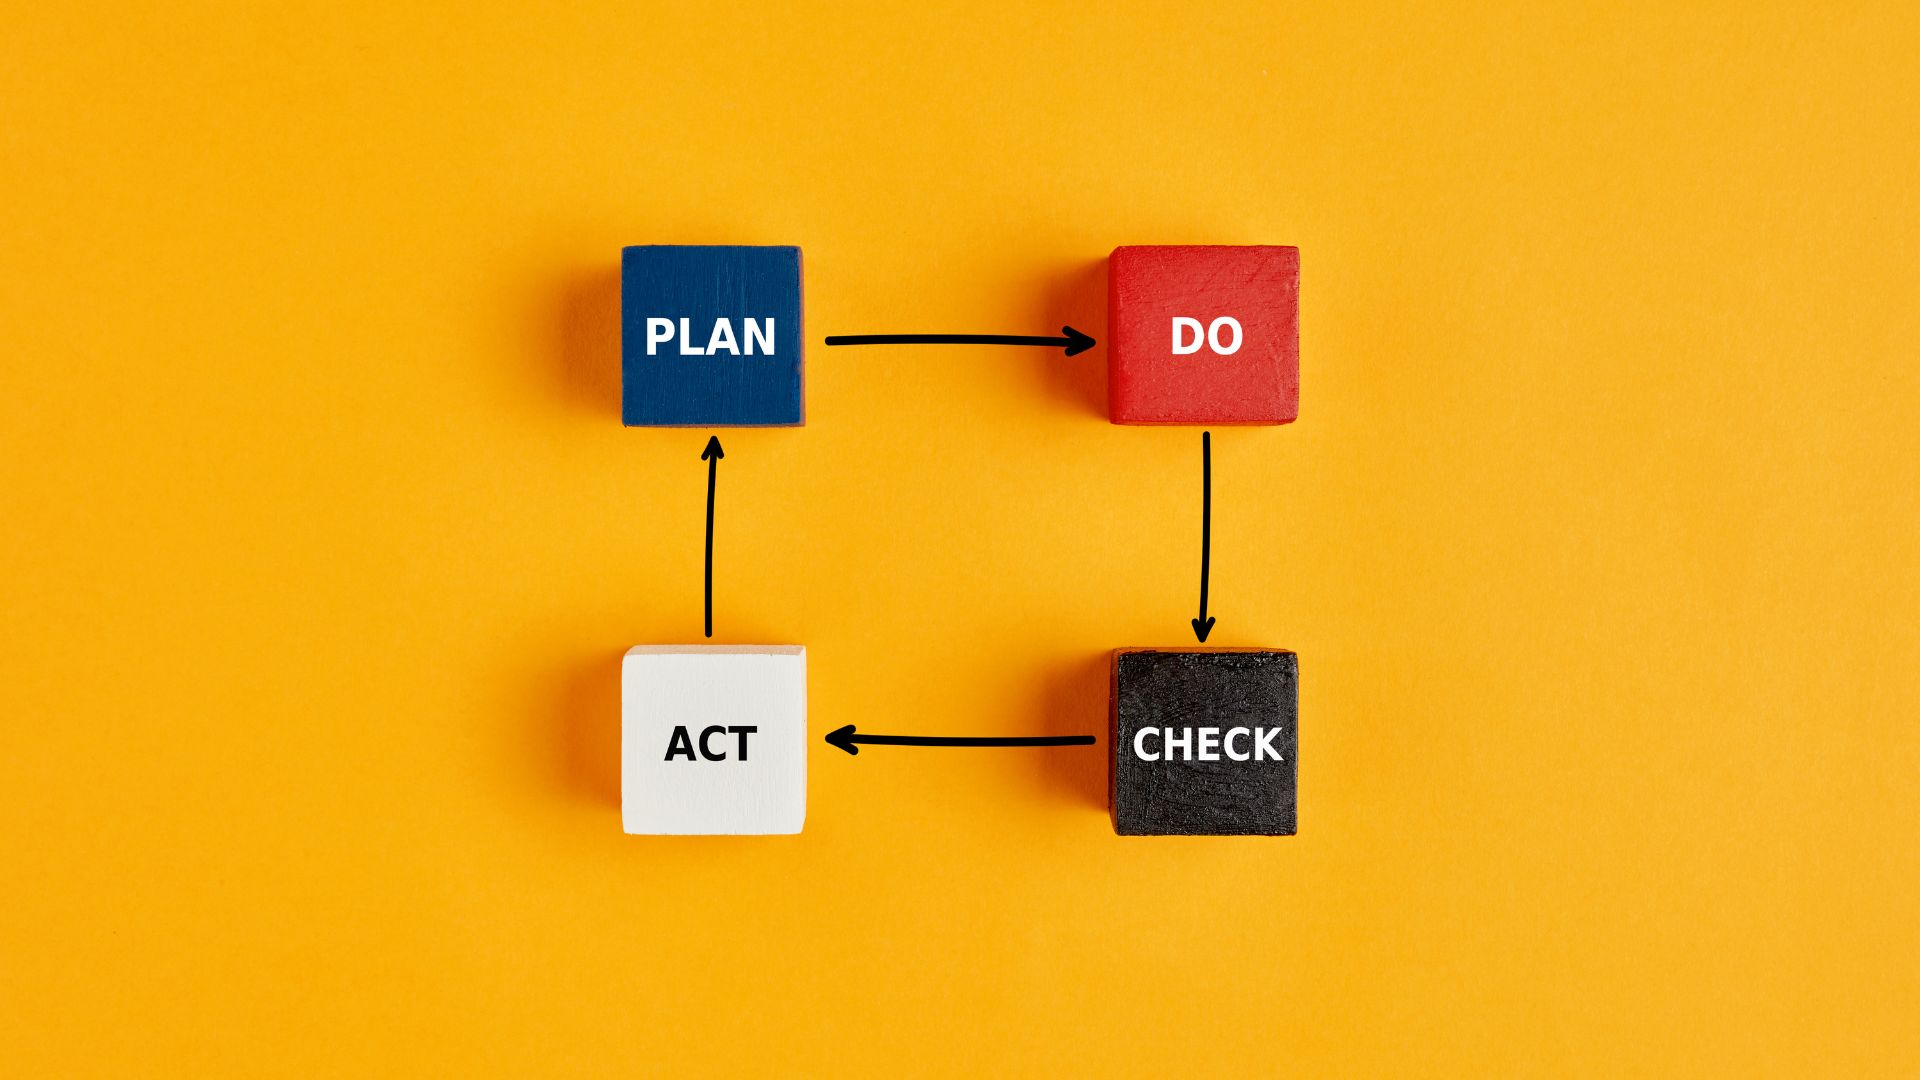
1) Practice of PDCA Cycle
The PDCA cycle is a method for realizing continuous improvement by repeating four steps: Plan, Do, Check, and Act. Let's look at the specific approach when applying this to Facebook advertising.
■ Plan: Strategy Formulation Based on Data
Analysis of Past Campaign Data
- Extracting features of successful campaigns.
- Organizing lessons learned from failure.
Market Trends and Competitor Analysis
- Reference industry benchmark indicators.
- Observing and analyzing competitor advertising strategies.
Clear Goal Setting
- Setting SMART (Specific, Measurable, Achievable, Relevant, Time-bound) goals.
- Selecting KPIs and setting goal values.
Formulating Audience Strategy
- Redefining and updating personas.
- Selecting targeting options.
Formulating Creative Strategy
- Creating an A/B test plan.
- Formulating guidelines for creative production.
■ Do: Implementation of Improvement Measures
Optimizing Campaign Settings
- Adjusting budget allocation.
- Implementing bidding strategies.
Introducing New Creatives
- Implementing A/B testing.
- Combinational optimization of videos, images, and texts.
Expanding or Narrowing Down the Audience
- Creating new custom audiences.
- Utilizing lookalike audiences.
Adjusting Platforms and Placement
- Optimizing placement based on performance.
- Implementing cross-platform strategy.
■ Check: Measurement and Analysis of Results
Real-Time Monitoring
- Daily/weekly performance checks.
- Early discovery of outliers or sudden changes.
Evaluating KPI Achievement Degree
- Checking progress status relative to set goals.
- Analyzing budget consumption rate and efficiency.
Performance Analysis by Segment
- Detailed analysis by demographic, device, and time slots.
- Identifying high-performance segments.
Evaluating A/B Test Results
- Confirm statistical significance.
- Determining winner variations.
■ Act: Formulation of the Next Action Plan
Formulating Improvement Measures Based on Analysis Results
- 成功要因の強化
- 問題点への対策立案
Optimizing Resource Allocation
- Budget shifting to high-performance campaigns.
- Stopping or fixing low-performance ads.
Planning New Measures
- Developing new audiences.
- Trialing new creative formats.
Long-Term Strategy Review and Adjustment
- Responding to market trend changes or competitor situations.
- Checking consistency with business goals.

2) Tips for Continuous Optimization
Improvement Points for Creatives
- Strengthening visual impact.
- Utilizing vivid color usage, human expressions, and dynamic images/videos.
- Maintaining freshness while keeping brand consistency.
Optimizing Copywriting
- Creating concise and attractive headlines.
- Elaborating body text that appeals to user pain points.
Clarification and Optimization of CTA
- Installing powerful CTA buttons that encourage action.
- Selecting CTA text matched to user psychology.
Utilizing Storytelling
- Creating narrative ads that appeal to user emotions.
- Improving user engagement through series ads.
Adjusting Bidding Strategy
- Selecting bid type according to purpose.
- Link clicks, impressions, conversions, etc.
Usage between Automatic and Manual Bidding
- Selection according to campaign maturity and management resources.
Dynamic Adjustment of Bid Amounts
- Flexible changes in bid amounts according to intensified competition periods or time slots.
Optimizing Budget Allocation
- Shifting budget to high-performance ad sets.
Expanding/Narrowing Down Audience
- Utilizing lookalike audiences.
- Creating similar audiences based on high-value customers.
- Testing multiple audiences with different similarities.
Optimizing Retargeting
- Effective reach to site visitors and app users.
- Adjusting messaging according to the purchasing cycle.
Refining Interest Targeting
- Combining multiple highly relevant interests.
- Appropriate setting of excluded audiences.
Utilizing Dynamic Audiences
- Real-time audience updates based on user behavior.
- Segmenting according to the stage of purchasing desire.
By utilizing these steps and tips and steadily rotating the PDCA cycle, continuous improvement and optimization of Facebook advertising campaigns become possible. Decision-making based on data and prompt response lead to maximizing ad effectiveness.
6. Frequently Asked Questions (Q&A)

Q1: How often are Facebook ad reports updated?
A: Facebook ad reports are usually updated in nearly real-time. However, it may take about 24 to 48 hours to finalize numerical values to ensure data integrity. In particular, indicators depending on external pixels or events, such as conversion data, may take time to be reflected.
Q2: Is report customization possible?
A: In Facebook Ads Manager, you can highly customize reports. You can select indicators to display, sort data, filter, and even create unique calculation indicators. This allows you to create optimal reports matched to business needs.
Q3: What measures should I take when the Click-Through Rate (CTR) is low?
A: If CTR is low, consider the following measures:
- Review creatives (ad images and texts).
- Re-examine and narrow down targeting.
- Check consistency between ad messages and target audience needs.
- Implement A/B testing to verify which elements are effective.
Q4: What should I do to improve the conversion rate?
A: The following approaches are effective for improving conversion rates:
- Landing page optimization (improving load speed, clarifying CTA (Call to Action)).
- Utilizing retargeting ads.
- Refining audience segmentation.
- Analyzing and improving the customer journey up to conversion.
Q5: What should I do if ROAS is below the target?
A: The following approaches are effective for improving ROAS:
- Reviewing advertising costs and stopping inefficient ad sets.
- Budget shifting to high-performance ad sets.
- Re-examining price strategies for products and services.
- Targeting toward higher-value audiences.
Q6: Is there a way to compare performance between competitors and my company?
A: While direct competitor comparison is difficult in Facebook advertising, it can be compared indirectly through the following methods:
- Utilizing Facebook benchmark reports.
- Comparing with indicators such as industry average CPM, CTR, and CVR.
- Analyzing competitor ad creatives using Facebook Ad Library.
Q7: How should I handle cases where there is a large performance difference between mobile and desktop?
A: Handling methods when performance differs between devices are as follows:
- Focus budget allocation on high-performance devices.
- Creating creatives optimized for each device.
- Checking and improving mobile compatibility of landing pages.
- Implementing bid adjustments by device.
Q8: How can I prevent Ad Fatigue?
A: The following approaches are effective for preventing ad fatigue:
- Regularly updating creatives (every 2-4 weeks).
- Rotating audiences.
- Setting frequency caps.
- Utilizing dynamic creatives.
Q9: How can I analyze performance by segment in detail?
A: The following approaches are effective for analysis by segment:
- Utilize breakdown functions to split data by age, gender, region, etc.
- Create custom audiences and compare each performance.
- Use Facebook Analytics to obtain more detailed customer insights.
Q10: What kind of reports are effective for grasping long-term trends?
A: The following reports are effective for grasping long-term trends:
- Create custom reports to visualize monthly or quarterly performance transitions.
- Create time-series graphs of major KPIs to analyze seasonality or growth trends.
- Implement cohort analysis to understand long-term behavioral patterns of customers.
これらの質問と回答を参考に、Facebook広告レポートの理解を深め、より効果的な広告運用を行ってください。
7.参考資料とリソース
Facebook広告の知識とスキルを向上させるための参考資料とリソースを以下にまとめました。これらを活用することで、より効果的な広告運用が可能になるでしょう。

1)Facebook公式リソース
Facebook広告ヘルプセンター
Facebook広告に関する公式の包括的なガイドと最新情報
基本的な設定から高度な戦略まで、幅広いトピックをカバー
Facebook Blueprint
Facebookが提供する無料のオンライン学習プラットフォーム
初心者から上級者まで、様々なレベルのコースを提供
Facebook広告ポリシー
広告の承認基準や禁止事項など、遵守すべきルールを確認
2)業界のベストプラクティス集
AdEspresso Blog
Facebook広告の最新トレンドや効果的な戦略に関する記事を定期的に公開
Social Media Examiner
ソーシャルメディアマーケティング全般の情報と、Facebook広告に特化した記事を提供
Jon Loomer Digital
Facebook広告の専門家による高度な戦略とテクニックの解説
Hootsuite Blog - Facebook Advertising
Facebook広告の基本から応用まで、実践的なアドバイスを提供
3)推奨ツールやリソース
Adspyアプリ
競合他社の広告をリサーチし、効果的な広告クリエイティブのアイデアを得るためのツール
Canva
簡単に高品質な広告クリエイティブを作成できるデザインツール
Facebook広告ライブラリ
他社の広告事例を参照し、アイデアを得るための無料ツール
SEMrush
競合分析や広告素材の検索に役立つ総合的なデジタルマーケティングツール
Hootsuite Insights
ソーシャルメディアの分析と洞察を提供するツール
Google Analytics
Facebook広告からのトラフィックとコンバージョンを詳細に分析するためのツール
Zapier
Facebook広告データを他のツールと連携させ、ワークフローを自動化するためのプラットフォーム
Facebook広告コミュニティ
Facebook広告の専門家や実践者が集まる公式コミュニティグループ
これらのリソースを活用することで、Facebook広告に関する knowledge を常に最新に保ち、効果的な広告運用のスキルを磨くことができます。定期的にこれらのリソースを参照し、新しい戦略やテクニックを学び続けることをおすすめします。
Tomira Facebook Ad Operation & Consulting

Tomira provides services specialized in Facebook ad operations. Our dedicated team handles everything from creative production to ad management and analysis consistently, implementing the optimal ad management for our clients. We enable distributions leveraging the characteristics of Facebook ads and utilize unique know-how obtained from extensive operational experience.
Operated by Professionals Specializing in Facebook Ads
Because it is operated by professionals with extensive knowledge well-versed in Facebook ads, you can leave it to us with peace of mind. Since ad management reflecting the latest trends is possible, significant growth in results can be expected.
Distribution Leveraging High-Precision Targeting
Tomira can perform distributions leveraging the characteristics of Facebook ads, which allow for high-precision targeting. Because we are well-versed in targeting settings, we support customer attraction and sales increases with optimal distribution tailored to each client's purpose and goal.
From Consulting to Operation
We can handle a wide range of requests, from consulting for accounts managed in-house to integrated operation outsourcing plans where we handle production, operation, and analysis together. We identify improvement points from daily operations, reflect them quickly, and support result enhancement.
| Item | Content |
|---|---|
Service Name | Tomira Facebook Ad Operation & Consulting |
Company Name | Tomira Inc. |
Address | BIZ SMART 235, 2-12-8 Kita-Aoyama, Minato-ku, Tokyo |
Business Content | ・Web/Digital Marketing Support |
Official Site | https://tomira.co.jp/marketing/ads/ads_facebook/ |
8. Summary
Through the detailed explanation of Facebook ad reports, we have shown important points from data analysis to campaign improvement.
Understanding and utilizing Facebook ad reports is indispensable for the success of digital marketing strategies. By putting the knowledge and techniques learned in this article into practice and accumulating continuous improvements, more effective Facebook ad operation will be realized.
Try to draw out the maximum potential of Facebook ads by keeping data-driven decision-making and continuous optimization in mind.